
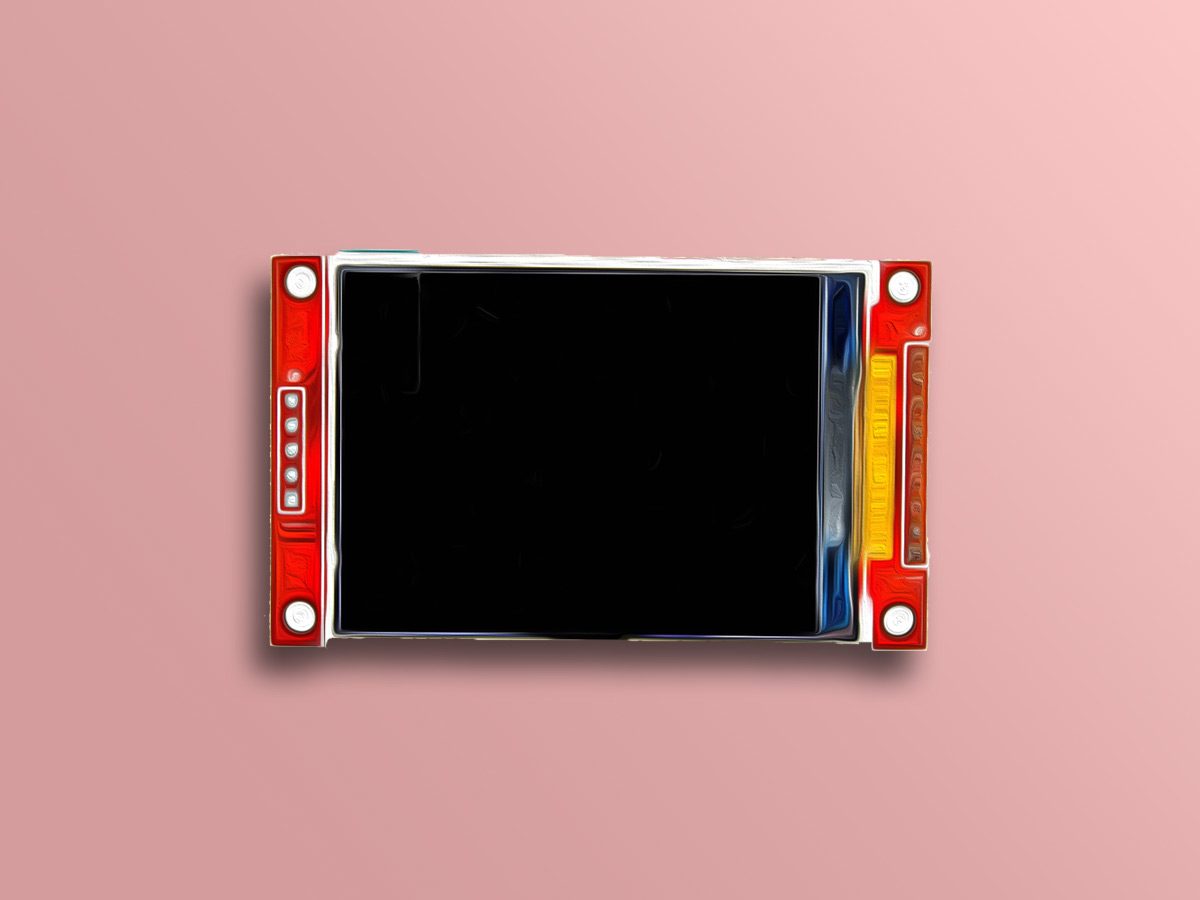
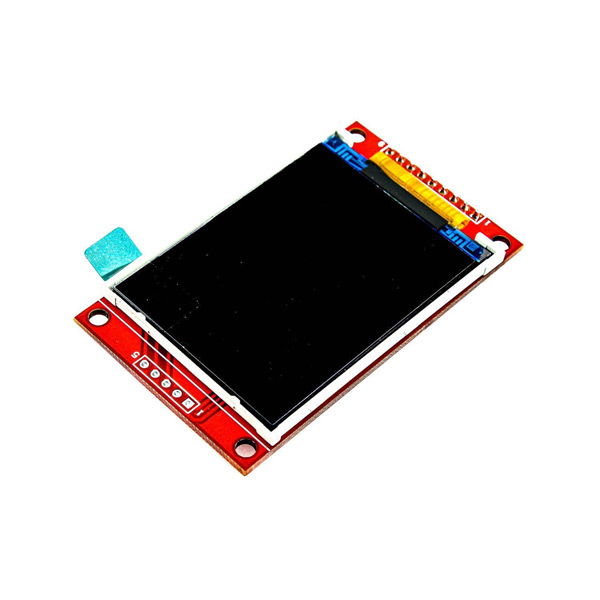
ویژگی های نمایشگر 2.2 اینچ TFT تمام رنگ
نمایشگر TFT از انواع ال سی دی های کریستال مایع میباشد که با یک ترانزیستور به هر پیکسل وصل شده است و همچنین علاوه بر مصرف جریان نسبتاً کم، دارای بک لایت (Backlight) نیز میباشد. این ماژول در اندازه 2.2 اینچ و به صورت تمام رنگ، دارای یک صفحه باریک PCB میباشد. رزولوشن این ماژول 280×320 پیکسل و دارای رابط کاربری SPI چهار سیمه و بک لایت سفید است.
این نمایشگر قابلیت اتصال SD کارت و SPI Flash را نیز دارد.
توجه
این ماژول با ولتاژ 3.3 کار می کند و برای استفاده با آردوینو باید از تقسیم ولتاژ استفاده شود.
جهت دریافت دیتاشیت و اطلاعات بیشتر نمایشگر 2.2 اینچ تمام رنگ به لینک زیر مراجعه شود.
http://www.lcdwiki.com/2.2inch_SPI_Module_ILI9341_SKU:MSP2202
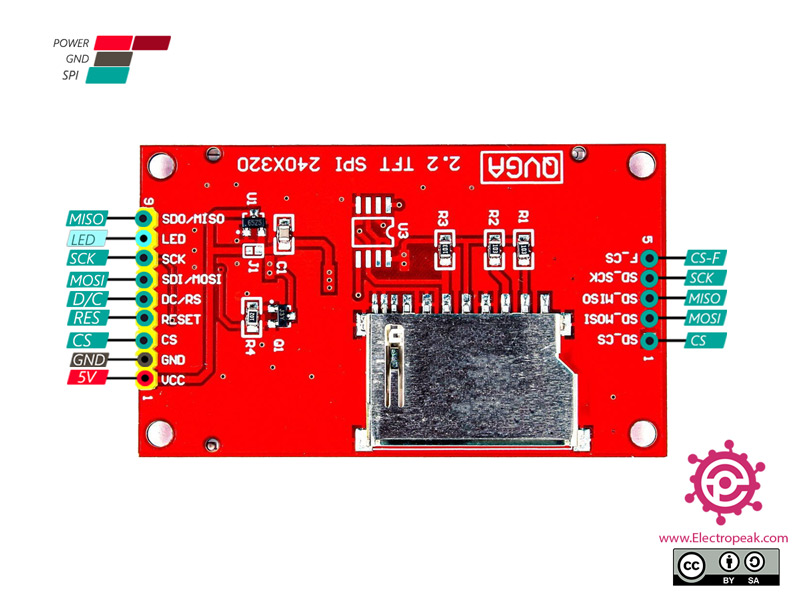
معرفی پایه ها (Pinout) نمایشگر 2.2 اینچ تمام رنگ
نمایشگر 2.2 اینچ تمام رنگ دارای 14 پایه به شرح زیر است:
- VIN: تغذیه ماژول –5-3.3 ولت
- GND: زمین
- RST: راه اندازی مجدد نمایشگر
- CS: انتخاب دستگاه های زیر مجموعه برای پروتکل SPI (نمایشگر)
- D/C: انتخاب نوع دیتا
- MOSI: خط ارسالی اطلاعات برای پروتکل SPI
- MISO: خط دریافتی اطلاعات برای پروتکل SPI
- SCK: همزمان سازی برای پروتکل SPI
- LED: کنترل نور پس زمینه
- SD-MOSI: خط ارسالی اطلاعات برای پروتکل SPI
- SD-MISO: خط دریافتی اطلاعات برای پروتکل SPI
- SD-SCK: همزمان سازی برای پروتکل SPI
- SD-CS: انتخاب دستگاه های زیر مجموعه برای پروتکل SPI (SD Card)
- F-CS: انتخاب دستگاه های زیر مجموعه برای پروتکل SPI (SPI FLASH)
پین اوت (Pinout) این نمایشگر را میتوانید در تصویر زیر مشاهده کنید.
لوازمی که به آن احتیاج دارید
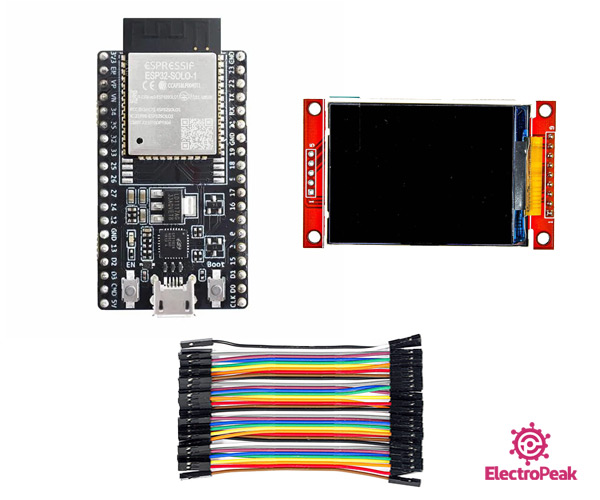
قطعات مورد نیاز
نرم افزارهای مورد نیاز
راه اندازی ماژول نمایشگر 2.2 اینچ تمام رنگ با ESP32
گام اول: سیم بندی
مطابق مدار زیر، نمایشگر را به ESP32 وصل کنید.

گام دوم: کتابخانه
ابتدا کتابخانه زیر را بر آردوینو IDE نصب کنید.
https://github.com/Bodmer/TFT_eSPI
پس از نصب کتابخانه به آدرس محل نصب شده کتابخانه مراجعه شود و فایل User_Setup.h را باز کرده و به خط
EDIT THE PIN NUMBERS IN THE LINES FOLLOWING TO SUIT YOUR ESP32 SETUP
مراجعه کرده و خط های زیر را از حالت کامنت خارج کنید و مابقی خط ها در صورتی که کامنت نیستند را کامنت کنید.
#define TFT_MISO 19
#define TFT_MOSI 23
#define TFT_SCLK 18
#define TFT_CS 15 // Chip select control pin
#define TFT_DC 2 // Data Command control pin
#define TFT_RST 4 // Reset pin (could connect to RST pin)
میتوانید فایل آماده را از لینک زیر دانلود کنید و در پروژه خود قرار دهید.
توجه
اگر نیاز به راهنمایی بیشتر برای نصب کتابخانه بر روی آردوینو دارید، می توانید به آموزش نصب کتابخانه بر آردوینو مراجعه کنید.
گام سوم: کد
کد زیر را روی برد ESP32 خود آپلود کنید.
   /*
  Example animated analogue meters using a ILI9341 TFT LCD screen

  Needs Font 2 (also Font 4 if using large scale label)

  Make sure all the display driver and pin comnenctions are correct by
  editting the User_Setup.h file in the TFT_eSPI library folder.

  #########################################################################
  ###### DON'T FORGET TO UPDATE THE User_Setup.h FILE IN THE LIBRARY ######
  #########################################################################
*/

#include <TFT_eSPI.h> // Hardware-specific library
#include <SPI.h>

TFT_eSPI tft = TFT_eSPI();       // Invoke custom library

#define TFT_GREY 0x5AEB

#define LOOP_PERIOD 35 // Display updates every 35 ms

float ltx = 0;    // Saved x coord of bottom of needle
uint16_t osx = 120, osy = 120; // Saved x & y coords
uint32_t updateTime = 0;       // time for next update

int old_analog =  -999; // Value last displayed
int old_digital = -999; // Value last displayed

int value[6] = {0, 0, 0, 0, 0, 0};
int old_value[6] = { -1, -1, -1, -1, -1, -1};
int d = 0;

void setup(void) {
  tft.init();
  tft.setRotation(0);
  Serial.begin(57600); // For debug
  tft.fillScreen(TFT_BLACK);

  analogMeter(); // Draw analogue meter

  // Draw 6 linear meters
  byte d = 40;
  plotLinear("A0", 0, 160);
  plotLinear("A1", 1 * d, 160);
  plotLinear("A2", 2 * d, 160);
  plotLinear("A3", 3 * d, 160);
  plotLinear("A4", 4 * d, 160);
  plotLinear("A5", 5 * d, 160);

  updateTime = millis(); // Next update time
}


void loop() {
  if (updateTime <= millis()) {
    updateTime = millis() + LOOP_PERIOD;

    d += 4; if (d >= 360) d = 0;

    //value[0] = map(analogRead(A0), 0, 1023, 0, 100); // Test with value form Analogue 0

    // Create a Sine wave for testing
    value[0] = 50 + 50 * sin((d + 0) * 0.0174532925);
    value[1] = 50 + 50 * sin((d + 60) * 0.0174532925);
    value[2] = 50 + 50 * sin((d + 120) * 0.0174532925);
    value[3] = 50 + 50 * sin((d + 180) * 0.0174532925);
    value[4] = 50 + 50 * sin((d + 240) * 0.0174532925);
    value[5] = 50 + 50 * sin((d + 300) * 0.0174532925);

    //unsigned long t = millis();

    plotPointer();

    plotNeedle(value[0], 0);

    //Serial.println(millis()-t); // Print time taken for meter update
  }
}


// #########################################################################
//  Draw the analogue meter on the screen
// #########################################################################
void analogMeter()
{
  // Meter outline
  tft.fillRect(0, 0, 239, 126, TFT_GREY);
  tft.fillRect(5, 3, 230, 119, TFT_WHITE);

  tft.setTextColor(TFT_BLACK);  // Text colour

  // Draw ticks every 5 degrees from -50 to +50 degrees (100 deg. FSD swing)
  for (int i = -50; i < 51; i += 5) {
    // Long scale tick length
    int tl = 15;

    // Coodinates of tick to draw
    float sx = cos((i - 90) * 0.0174532925);
    float sy = sin((i - 90) * 0.0174532925);
    uint16_t x0 = sx * (100 + tl) + 120;
    uint16_t y0 = sy * (100 + tl) + 140;
    uint16_t x1 = sx * 100 + 120;
    uint16_t y1 = sy * 100 + 140;

    // Coordinates of next tick for zone fill
    float sx2 = cos((i + 5 - 90) * 0.0174532925);
    float sy2 = sin((i + 5 - 90) * 0.0174532925);
    int x2 = sx2 * (100 + tl) + 120;
    int y2 = sy2 * (100 + tl) + 140;
    int x3 = sx2 * 100 + 120;
    int y3 = sy2 * 100 + 140;

    // Yellow zone limits
    //if (i >= -50 && i < 0) {
    //  tft.fillTriangle(x0, y0, x1, y1, x2, y2, TFT_YELLOW);
    //  tft.fillTriangle(x1, y1, x2, y2, x3, y3, TFT_YELLOW);
    //}

    // Green zone limits
    if (i >= 0 && i < 25) {
      tft.fillTriangle(x0, y0, x1, y1, x2, y2, TFT_GREEN);
      tft.fillTriangle(x1, y1, x2, y2, x3, y3, TFT_GREEN);
    }

    // Orange zone limits
    if (i >= 25 && i < 50) {
      tft.fillTriangle(x0, y0, x1, y1, x2, y2, TFT_ORANGE);
      tft.fillTriangle(x1, y1, x2, y2, x3, y3, TFT_ORANGE);
    }

    // Short scale tick length
    if (i % 25 != 0) tl = 8;

    // Recalculate coords incase tick lenght changed
    x0 = sx * (100 + tl) + 120;
    y0 = sy * (100 + tl) + 140;
    x1 = sx * 100 + 120;
    y1 = sy * 100 + 140;

    // Draw tick
    tft.drawLine(x0, y0, x1, y1, TFT_BLACK);

    // Check if labels should be drawn, with position tweaks
    if (i % 25 == 0) {
      // Calculate label positions
      x0 = sx * (100 + tl + 10) + 120;
      y0 = sy * (100 + tl + 10) + 140;
      switch (i / 25) {
        case -2: tft.drawCentreString("0", x0, y0 - 12, 2); break;
        case -1: tft.drawCentreString("25", x0, y0 - 9, 2); break;
        case 0: tft.drawCentreString("50", x0, y0 - 6, 2); break;
        case 1: tft.drawCentreString("75", x0, y0 - 9, 2); break;
        case 2: tft.drawCentreString("100", x0, y0 - 12, 2); break;
      }
    }

    // Now draw the arc of the scale
    sx = cos((i + 5 - 90) * 0.0174532925);
    sy = sin((i + 5 - 90) * 0.0174532925);
    x0 = sx * 100 + 120;
    y0 = sy * 100 + 140;
    // Draw scale arc, don't draw the last part
    if (i < 50) tft.drawLine(x0, y0, x1, y1, TFT_BLACK);
  }

  tft.drawString("%RH", 5 + 230 - 40, 119 - 20, 2); // Units at bottom right
  tft.drawCentreString("%RH", 120, 70, 4); // Comment out to avoid font 4
  tft.drawRect(5, 3, 230, 119, TFT_BLACK); // Draw bezel line

  plotNeedle(0, 0); // Put meter needle at 0
}

// #########################################################################
// Update needle position
// This function is blocking while needle moves, time depends on ms_delay
// 10ms minimises needle flicker if text is drawn within needle sweep area
// Smaller values OK if text not in sweep area, zero for instant movement but
// does not look realistic... (note: 100 increments for full scale deflection)
// #########################################################################
void plotNeedle(int value, byte ms_delay)
{
  tft.setTextColor(TFT_BLACK, TFT_WHITE);
  char buf[8]; dtostrf(value, 4, 0, buf);
  tft.drawRightString(buf, 40, 119 - 20, 2);

  if (value < -10) value = -10; // Limit value to emulate needle end stops
  if (value > 110) value = 110;

  // Move the needle util new value reached
  while (!(value == old_analog)) {
    if (old_analog < value) old_analog++;
    else old_analog--;

    if (ms_delay == 0) old_analog = value; // Update immediately id delay is 0

    float sdeg = map(old_analog, -10, 110, -150, -30); // Map value to angle
    // Calcualte tip of needle coords
    float sx = cos(sdeg * 0.0174532925);
    float sy = sin(sdeg * 0.0174532925);

    // Calculate x delta of needle start (does not start at pivot point)
    float tx = tan((sdeg + 90) * 0.0174532925);

    // Erase old needle image
    tft.drawLine(120 + 20 * ltx - 1, 140 - 20, osx - 1, osy, TFT_WHITE);
    tft.drawLine(120 + 20 * ltx, 140 - 20, osx, osy, TFT_WHITE);
    tft.drawLine(120 + 20 * ltx + 1, 140 - 20, osx + 1, osy, TFT_WHITE);

    // Re-plot text under needle
    tft.setTextColor(TFT_BLACK);
    tft.drawCentreString("%RH", 120, 70, 4); // // Comment out to avoid font 4

    // Store new needle end coords for next erase
    ltx = tx;
    osx = sx * 98 + 120;
    osy = sy * 98 + 140;

    // Draw the needle in the new postion, magenta makes needle a bit bolder
    // draws 3 lines to thicken needle
    tft.drawLine(120 + 20 * ltx - 1, 140 - 20, osx - 1, osy, TFT_RED);
    tft.drawLine(120 + 20 * ltx, 140 - 20, osx, osy, TFT_MAGENTA);
    tft.drawLine(120 + 20 * ltx + 1, 140 - 20, osx + 1, osy, TFT_RED);

    // Slow needle down slightly as it approaches new postion
    if (abs(old_analog - value) < 10) ms_delay += ms_delay / 5;

    // Wait before next update
    delay(ms_delay);
  }
}

// #########################################################################
//  Draw a linear meter on the screen
// #########################################################################
void plotLinear(char *label, int x, int y)
{
  int w = 36;
  tft.drawRect(x, y, w, 155, TFT_GREY);
  tft.fillRect(x + 2, y + 19, w - 3, 155 - 38, TFT_WHITE);
  tft.setTextColor(TFT_CYAN, TFT_BLACK);
  tft.drawCentreString(label, x + w / 2, y + 2, 2);

  for (int i = 0; i < 110; i += 10)
  {
    tft.drawFastHLine(x + 20, y + 27 + i, 6, TFT_BLACK);
  }

  for (int i = 0; i < 110; i += 50)
  {
    tft.drawFastHLine(x + 20, y + 27 + i, 9, TFT_BLACK);
  }

  tft.fillTriangle(x + 3, y + 127, x + 3 + 16, y + 127, x + 3, y + 127 - 5, TFT_RED);
  tft.fillTriangle(x + 3, y + 127, x + 3 + 16, y + 127, x + 3, y + 127 + 5, TFT_RED);

  tft.drawCentreString("---", x + w / 2, y + 155 - 18, 2);
}

// #########################################################################
//  Adjust 6 linear meter pointer positions
// #########################################################################
void plotPointer(void)
{
  int dy = 187;
  byte pw = 16;

  tft.setTextColor(TFT_GREEN, TFT_BLACK);

  // Move the 6 pointers one pixel towards new value
  for (int i = 0; i < 6; i++)
  {
    char buf[8]; dtostrf(value[i], 4, 0, buf);
    tft.drawRightString(buf, i * 40 + 36 - 5, 187 - 27 + 155 - 18, 2);

    int dx = 3 + 40 * i;
    if (value[i] < 0) value[i] = 0; // Limit value to emulate needle end stops
    if (value[i] > 100) value[i] = 100;

    while (!(value[i] == old_value[i])) {
      dy = 187 + 100 - old_value[i];
      if (old_value[i] > value[i])
      {
        tft.drawLine(dx, dy - 5, dx + pw, dy, TFT_WHITE);
        old_value[i]--;
        tft.drawLine(dx, dy + 6, dx + pw, dy + 1, TFT_RED);
      }
      else
      {
        tft.drawLine(dx, dy + 5, dx + pw, dy, TFT_WHITE);
        old_value[i]++;
        tft.drawLine(dx, dy - 6, dx + pw, dy - 1, TFT_RED);
      }
    }
  }
}
این کد جهت تست نمایشگر میباشد و انواع اشکال و طرحهای مختلف را به صورت گرافیکی نمایش میدهد.

Comments (6)
با برد اردوینو میشود راه انداختش ؟
سلام،
بله مشکلی نداره و با آردوینو و یا هر میکروکنترلر دیگهای هم میتونید این نمایشگر رو راهاندازی کنید. تنها نکتهای که لازمه در نظر گرفت این هست که ولتاژ کاری این نمایشگر 3.3 ولت هست و به همین دلیل برای اتصال پایههای این نمایشگر به پایههای آردوینو که ولتاژ کاری 5 ولت داره، بهتره که از تقسیم مقاومتی استفاده کنید. برای اطلاعات کاملتر از نحوه اتصال این نمایشگر به برد آردوینو و کدنویسی اون میتونید از لینکهای زیر هم کمک بگیرید.
“https://www.youtube.com/watch?v=tHujRzbWQos”
“https://www.youtube.com/watch?v=mBZlw9KJoz4”
سلام وقت بخیر
ایا با این اموزش میشه تصویر مورد نظرمون رو از طریق کامپیوتر یا موبایل به واسطه اینترنت و از راه دور به نمایشگر ارسال کرد
سلام.
وقت شما هم بخیر.
خیر از این آموزش برای این کار نمیشه استفاده کرد.
سلام و خسته نباشید خدمت مهندسین عزیز
بنده سعی دارم با یک ماژول نمایشگر ۳.۵ و برد esp32 که بصورت یکپارچه بهم نصب هستن یک عکس رو نمایشگر نمایش بدم ،هم از طریق تبدیل عکس به کد و هم از طریق sd کارت هربار هم عکس اپلود میشه و نمایش داده میشه ولی رنگها قاطی هستن و عکس بی کیفیت و بصورت نقاشی نمایش داده میشه ،میشه لطفا ایراد کار رو بهم بگید ،ممنونم
تراشه نمایشگر st7796 هست و از کتابخونه espi استفاده میکنم
با سلام
بالاترین کیفیت رو میتوانید از طریق کتابخانه JPEG_Decoder که داخل TFT_eSPI آمده است استفاده بنمایید و فایل jpeg را درون SDبریزید و مستقیم نمایش بدهید. این مورد بر روی ILI9488 تست شده و عالی جواب میدهد.
در مورد st7796 تنظیمات کنترل رنگ داخل کتابخانه tft_espi وجود دارد و میتوانید از آن نیز استفاده بنمایید.